Why do you need a dashboard?
Every sales manager would love to have an at-a-glance view of a set of reports that they use often. One optimal solution to help them
derive insights
follow up on the team’s performance
make important, timely decisions with ease about their team, revenue, prospects and a lot more
is a dashboard.
Even as a sales rep, you can assess your prospects, your progress for the month(win rate) and much more with ease using the dashboard view.
A. What are the out-of-box dashboards available by default?
Freshsales provides two default dashboard views
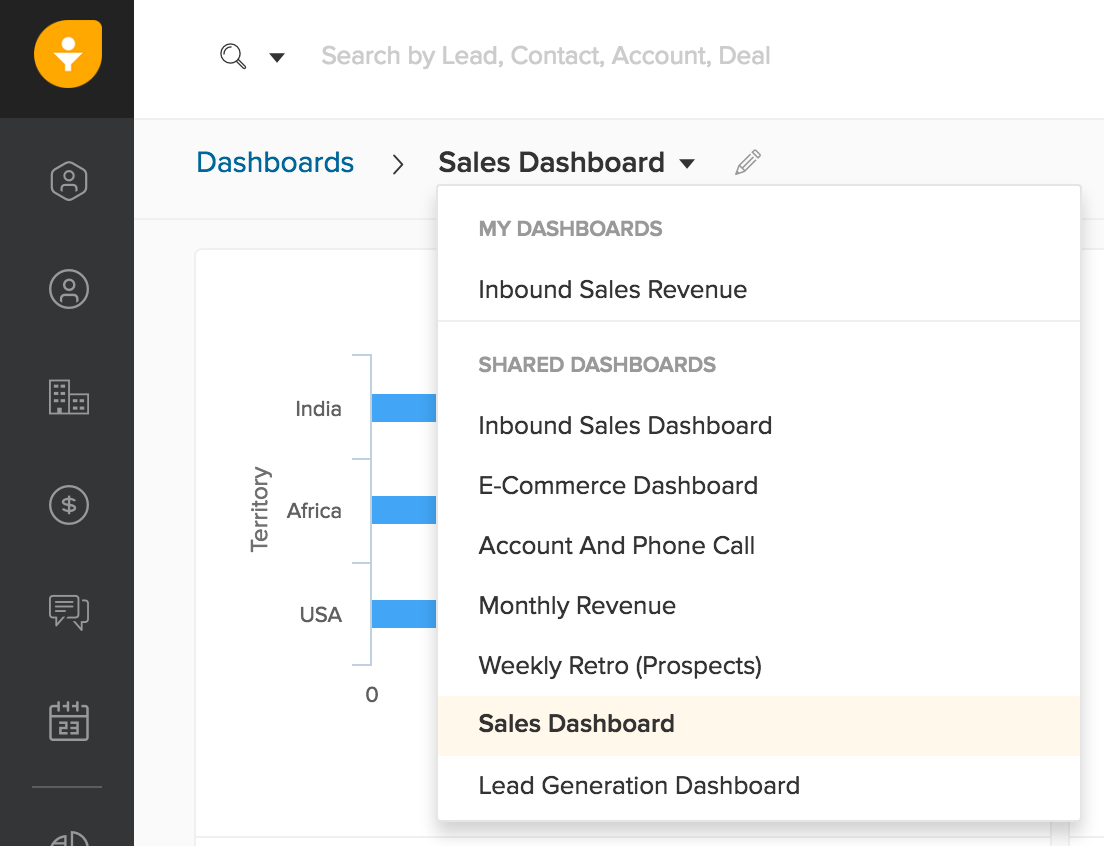
(i) Sales dashboard
(ii) Lead Generation dashboard
By default, you’ll see the sales dashboard with the following reports in it
Deal Conversion - This Month
Sales Velocity Report
Sales Trend - Last 90 days
Expected Sales - This Month
Sales This Month
New Business vs Upgrades
2. And the Lead Generation dashboard has these reports:
Leads generated this month
Leads converted this month
Leads converted - by territory
Leads converted - by source
Leads converted - by owner
Lead Velocity Report
3. You can either edit the existing dashboard by replacing the reports with
ones that are most relevant to you. Or you can create one from scratch.
B. How to customize your dashboard?
Customizing dashboard details:
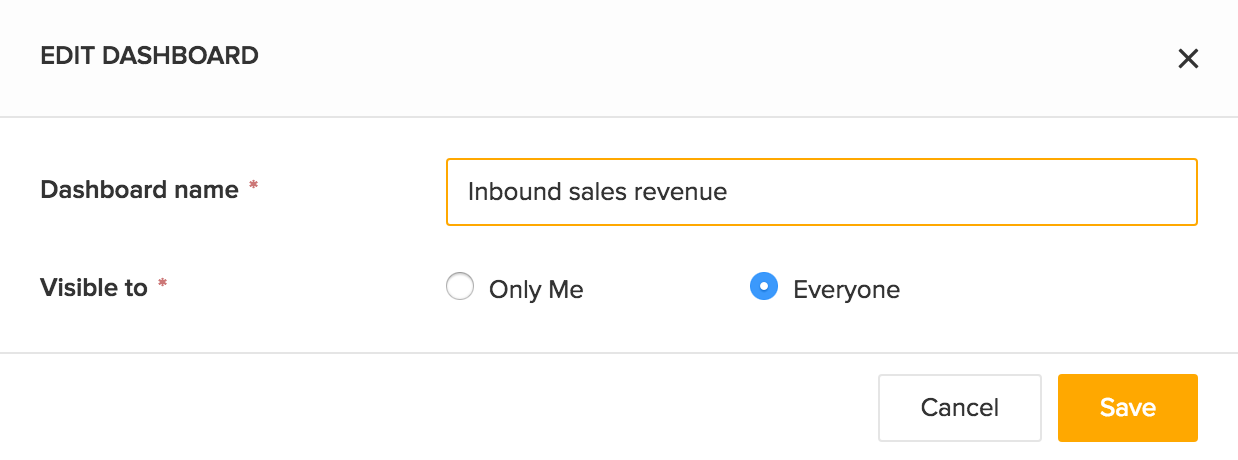
1. Edit:
Click the edit icon next to the My dashboards drop-down.
Edit the dashboard’s name and visibility in the pop up that appears.
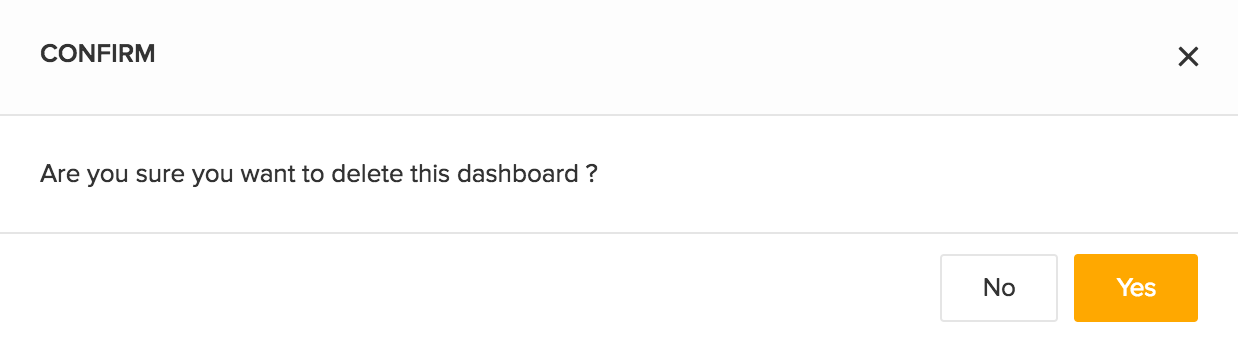
2. Delete:
You can delete an entire dashboard by clicking the delete icon.
Confirm and click Yes to successfully delete the dashboard.
3. Change your view:
You can shift between different dashboards by using the My
Dashboards drop-down.
Customizing report details:
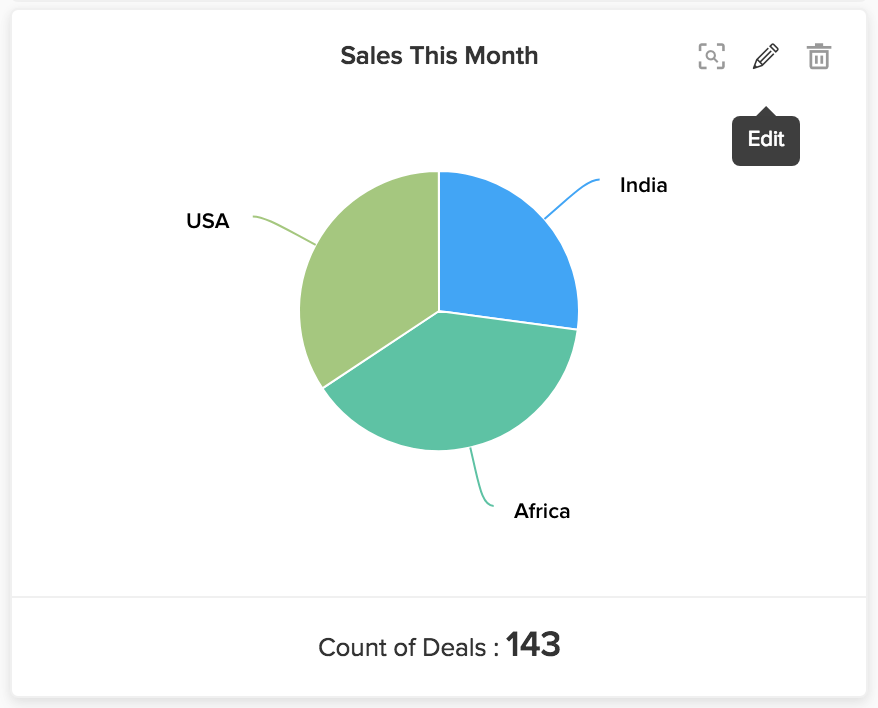
1. Edit:
Hover over any report to find the edit icon.
You can edit the metrics you want to see or even replace it with another report in total.

2. Delete: If any report of the dashboard gets obsolete, you can just
remove it.
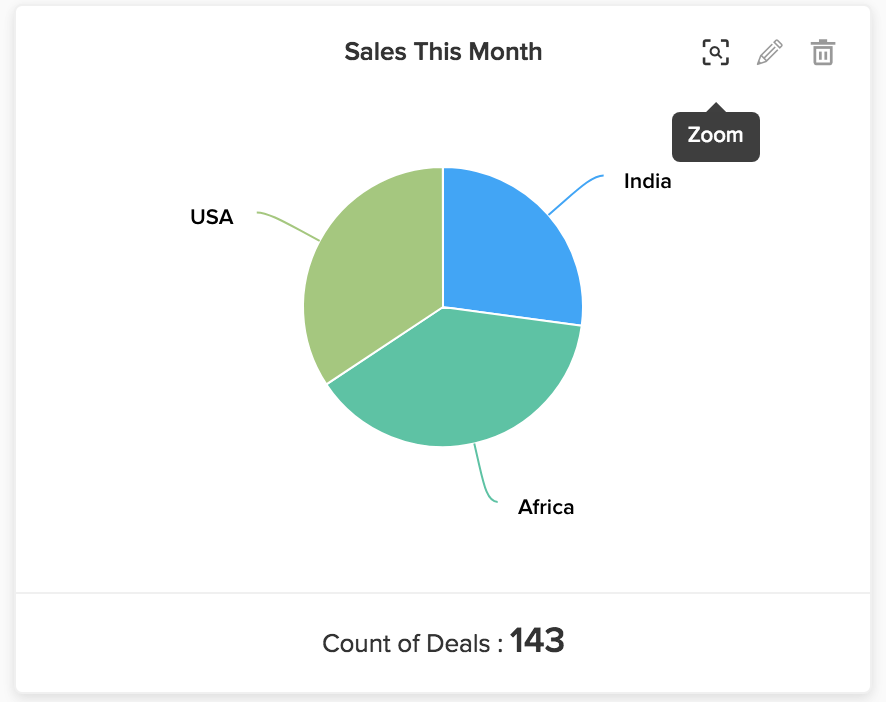
3. Zoom:
Zoom into each report by clicking the zoom icon on the top right
corner of the report or the View more link.
In this view, you can switch between the graph or the tabular data.
By clicking the Go to report icon(right next to the close symbol), you can go to your reports tab.


How do I share my dashboard with my team?
Change visibility:
By editing the dashboard, you can choose to make it visible to everyone in your team or keep it private to you.
2. Schedule:
Click the dropdown button next to the Create Dashboard button.
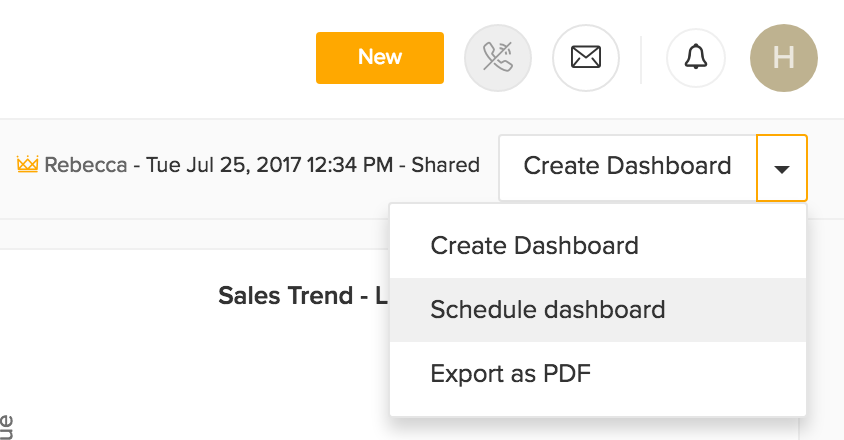
Click the schedule dashboard option.
The schedule dashboard overlay slides in. Now, fill in the required details.
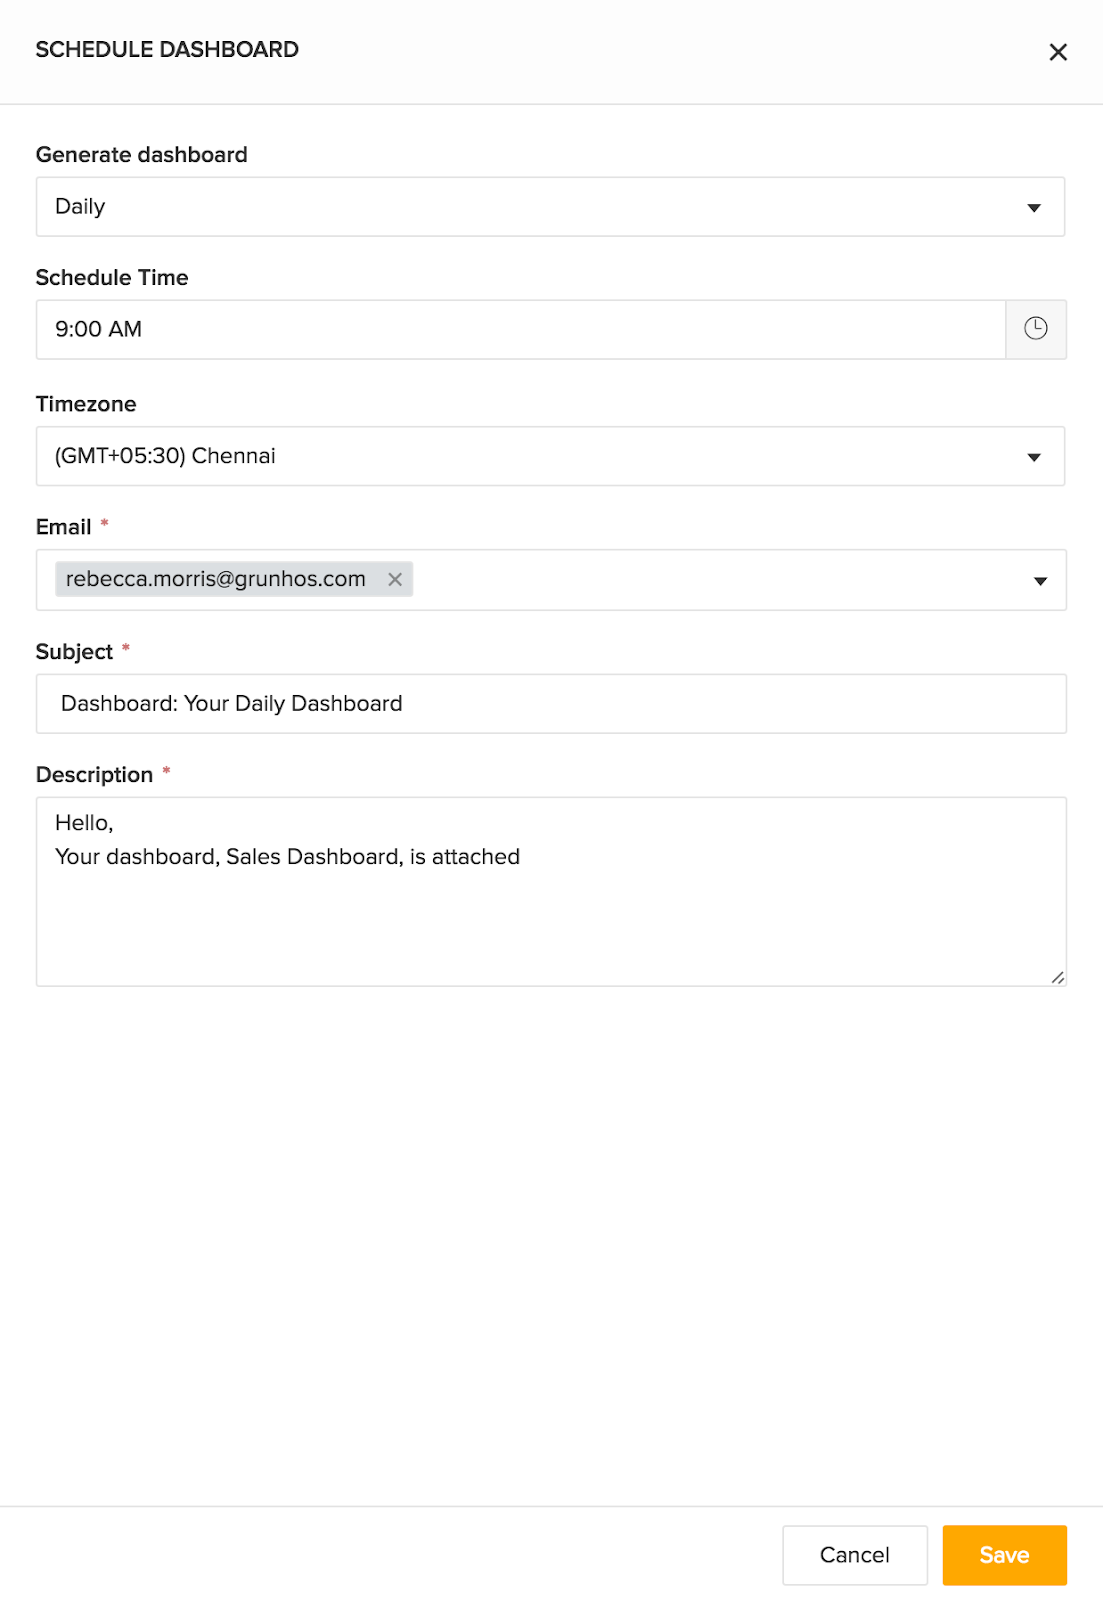
The fields are pre-filled with default information. You can edit any field's value if needed.
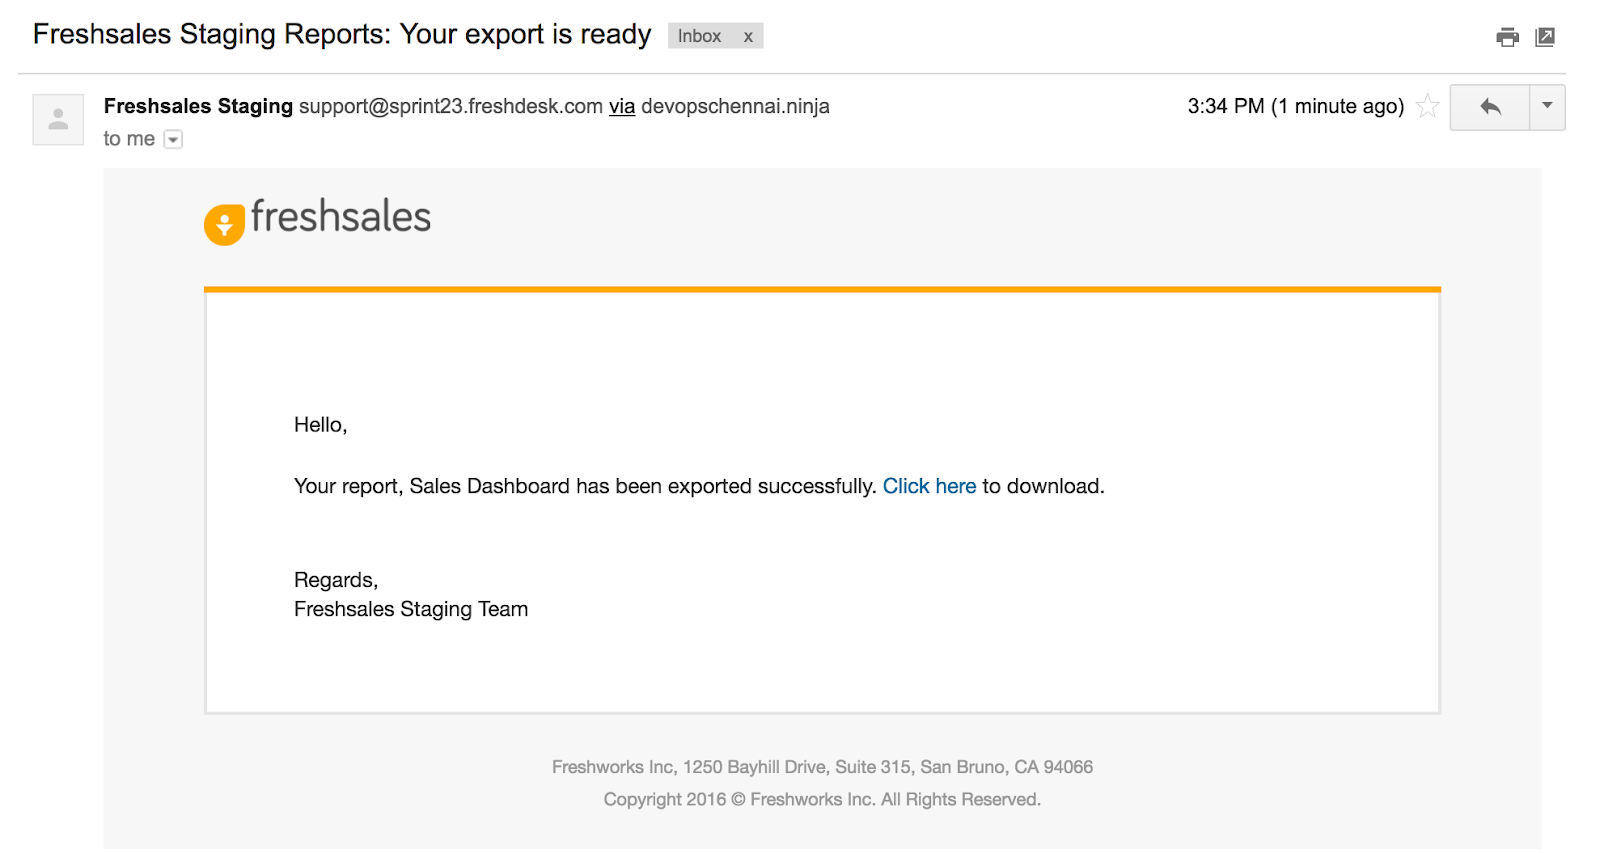
3. Export:
Your dashboard’s reports can be downloaded as a pdf.
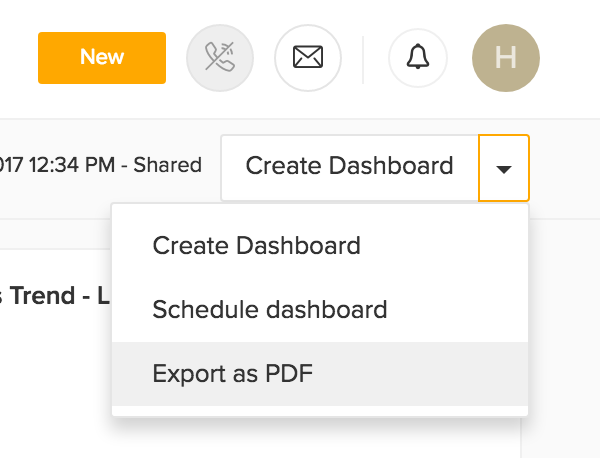
Just click the Export as pdf from the drop-down.

You’ll receive the following email:
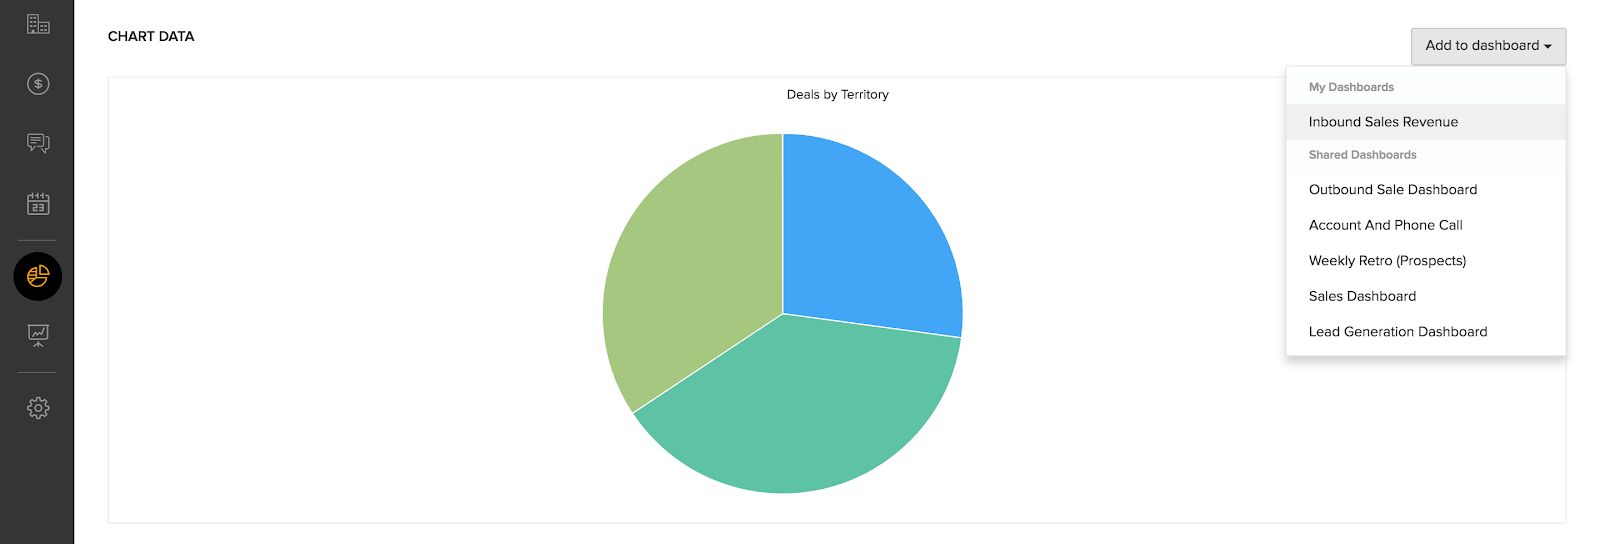
Can I add reports into an existing dashboard from the reports section?
Yes!
Click the Add to Dashboard drop down near the Chart section of the report to do so.
|
Note:
|